![]()
Displaying Test Results
After a Test-run is complete, results are stored in the Repository from where they are available for immediate display and analysis. The data collected can be displayed alongside results from previous Test-runs associated with the Test, to provide comparative information about the performance of target systems.
Use Commander to control which results are displayed and how they are presented, in order to help you analyze the performance of target WAEs and the network used to run the Test.
Open the Test you want from the Repository Window and click on the
Results Tab in the Test Pane, then choose the results you want to display using the Results Window. Depending on the category of results you select, data is displayed in graph or table format. You can choose from a wide range of tables and customizable graphs to display your results which can be filtered and exported for further analysis and print.
Use the Results Window to view multiple graphs and tables simultaneously to compare results from different Test-runs.
When a Test is run a wide range of results data is collected automatically. Virtual User response times and resource utilization information is recorded from all Web sites under test, along with performance data from WAE components and the Hosts used to run the Test.
Results categories include the Test Summary option which presents a brief description of the Test and the Task Groups settings that applied during a Test-run. The Test Audit log records significant events that occur during a Test-run and the HTTP Data List records the HTTP/S requests issued, including the response times and codes for every request. The Timer List option records the length of time taken to load each Web page defined in the Scripts referenced by a Test.
Creating and referencing Collectors in a Test helps to improve the quality and extend the range of the results data produced during a Test-run. NT Performance and SNMP Collectors give you the ability to target the Host computers and devices used to run a Test and the components of WAEs under test, with user-defined data collection queries.
Results collected by all the SNMP Collectors included in a Test are saved in the Custom SNMP file. Results collected by all the NT Performance Collectors you include are saved in the Custom NT Performance file. Results are displayed by opening a Test, then using the Results Window displayed in the Results Tab of the Test Pane to open the display options listed. Results data can be can be exported to spreadsheet and database programs for further analysis, or printed directly from Commander.
The range of results produced during a Test-run can depend on the content of the Scripts that are referenced in a Test. For example Report and History logs are only produced if the Scripts included have been modeled to incorporate the SCL commands used to generate the data content for these logs.
Results Tab
Results are stored in the Repository after a Test-run is complete. You can view them by working from the Repository Window to open the Test you want, then click on the
Use the Results Window to select the results you want to view in the workspace of the Test Pane. You can reposition the Results Window by floating it over the Main Window to give yourself more room for results display, or close it once you have selected the results options you want to view.
The Results Tab of the Test Pane
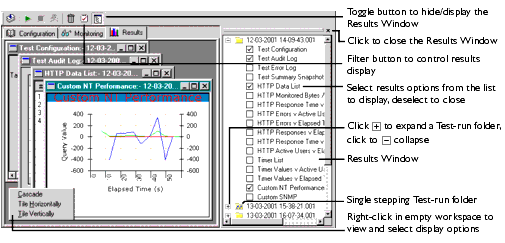
The Results Window
When you click on the Results Tab, the Results Window opens automatically. Its default location is on the right-hand side of the Test Pane where it is docked. Use it to select and display results from any of the Test-runs associated with the current Test.
Test-runs are stored in date and time stamped folders which you can double-click on to open, or click
. When you open a Test-run folder, the available results are listed below. Display the results you want by clicking on the options and ticking the check boxes to the left of the results options. The results you choose are displayed in the Test Pane.
Multiple graphs and tables from different Test-runs associated with the current Test can be displayed concurrently. Use the Results Window to select additional Test-runs and equivalent results options to compare Test results and help evaluate performance.
Display Test Results
- In the Repository Window, double-click
Tests to expand the directory structure.
- Double-click PRESIDENT_SEARCH
, to open the Test.
- In the Test Pane click the
- In the Results Window, double-click on a Test-run folder or click
- Click on a results option to display your selection in the Test Pane.
- A ticked check box to the left of a results option indicates that it is open in the Test Pane.
- Note: Click
, in the title bar of a graph or table to close it or deselect the results option in the Results Window by clicking on the option.
- Tip: All available results have display and output options associated with them, These may include filtering, customizing and exporting. Right-click within a graph or table to display and select from the choices available.
- Use the Windows option in the Menu Bar to control the display of graphs and tables. Alternatively, right-click within the empty workspace of the Test Pane to access these functions.
Results Tab Display Options
Graphs can be customized to improve the presentation of data by right-clicking within a graph then selecting Customize. This function includes options that enable you to modify the graph style from the default line plot to a vertical bar, as well as controlling the color of elements within the graph display.
You can control the information displayed in some graphs and tables by filtering the data they represent. Right-click within a graph or table, then select Filter or Filter URLs, or click the Filter button
in the toolbar and make your selection. You can also opt to export results data for further analysis and printing. Right-click and select Export to Excel or Export from the menu.
You can also zoom in on a graph by clicking and dragging over the area of the graph you want to study. Use the Windows option to control the presentation of results options in the Test Pane, or right-click within the empty workspace of the Test Pane to access these functions as illustrated in the diagram above.
Next...
Now that you have created and run your first Test, try experimenting with the Task Group settings to increase the load produced and generate a variety of results for comparison.
Move on to the next section for details.Next Section: Increase the Load Generated During a Test-run
Back to Contents
|
OpenSTA.org Mailing Lists Documentation feedback |