![]()
Results Display
- Results Display Overview
- Results Tab
- General Results Display Procedures
- Test Configuration
- Test Audit Log
- Test Report Log
- Test History Log
- Test Error Log
- Test Summary Snapshots
- HTTP Data List
- HTTP Data Graphs
- Single Step Results
- Timer List
- SNMP and NT Performance Collector Graphs
Results Display Overview
HTTP/S Load provides a variety of data collection and display options to assist you in the analysis of Test results. Running a Test and displaying the results enables you to identify whether the Web Application Environments (WAEs) under test are able to meet the processing demands you anticipate will be placed on them. After a Test-run is complete use Commander to control which results are displayed and how they are presented, in order to help you analyze the performance of target WAEs and the network used to run the Test.
Open the Test you want from the Repository Window and click on the
Results tab in the Test Pane, then choose the results you want to display using the Results Window. Depending on the category of results you select, data is displayed in graph or table format. You can choose from a wide range of tables and customizable graphs to display your results which can be filtered and exported for further analysis and print. Use the Results Window to view multiple graphs and tables simultaneously to compare results from different Test-runs.
When a Test is run a wide range of results data is collected automatically. Virtual User response times and resource utilization information is recorded from all Web sites under test, along with performance data from WAE components and the Hosts used to run the Test. Results categories include the Test Configuration option which presents a brief description of the Test and the Task Groups settings that applied during a Test-run. The Test Audit log records significant events that occur during a Test-run and the HTTP Data List records the HTTP/S requests issued, including the response times and codes for every request. The Timer List option records the length of time taken to load each Web page defined in the Scripts referenced by a Test.
Creating and referencing Collectors in a Test helps to improve the quality and extend the range of the results data produced during a Test-run. Collectors give you the ability to target the Host computers and devices used to run a Test and the back-end database components of WAEs under test, with user-defined data collection queries. Use NT Performance and SNMP Collectors to collect data from Host devices within target WAEs or the test network.
The range of results produced during a Test-run can depend on the content of the Scripts that are referenced by a Test. For example Report and History logs are only produced if the Scripts included have been modeled to incorporate the SCL commands used to generate the data content for these logs.
See also:
General Results Display Procedures
SNMP and NT Performance Collector Graphs
Results Tab
Results are stored in the Repository after a Test-run is complete. You can view them by working from the Repository Window to open the Test you want, then click on the
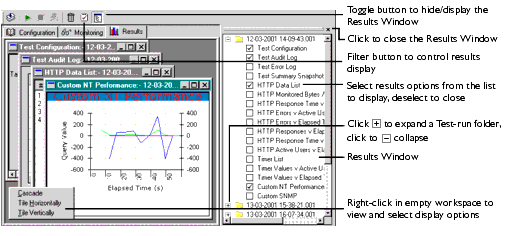
The Results Tab of the Test Pane
Results Tab Display Options
Graphs can be customized to improve the presentation of data by right-clicking within a graph then selecting Customize. This function includes options that enable you to modify the graph style from the default line plot to a vertical bar, as well as controlling the color of elements within the graph display.
You can control the information displayed in some graphs and tables by filtering the data they represent. Right-click within a graph or table, then select Filter or Filter URLs, or click the Filter button
in the toolbar and make your selection. You can also opt to export results data for further analysis and printing. Right-click and select Export to Excel or Export from the menu.
You can also zoom in on a graph by clicking and dragging over the area of the graph you want to study. Use the Windows option to control the presentation of results options in the Test Pane, or right-click within the empty workspace of the Test Pane to access these functions as illustrated in the diagram above.
See also:
The Results Window
When you click on the Results tab, the Results Window opens automatically. Its default location is on the right-hand side of the Test Pane where it is docked. Use it to select and display results from any of the Test-runs associated with the current Test.
Test-runs are stored in date and time stamped folders which you can double-click on to open, or click
. When you open a Test-run folder, the available results are listed below. Display the results you want by clicking on the options and ticking the check boxes to the left of the results options. The results you choose are displayed in the Test Pane.
Multiple graphs and tables from different Test-runs associated with the current Test can be displayed concurrently. Use the Results Window to select additional Test-runs and equivalent results options to compare Test results and help evaluate performance.
Results Window Display Options
The Results Window is located on the right-hand side of the Test Pane. It can be closed to increase the workspace area available, or moved to a new position by floating it over the Main Window.
See also:
Hide/Display The Results Window
Hide/Display The Results Window
- Click
, in the double bar at the top of the Results Window to close it.
- Click
in the toolbar to toggle between hiding and displaying the Results Window.
Move The Results Window
- Click on the double bar at the top of the Results Window.
- Drag, then drop it in the new position within the Main Window.
Resize The Results Window
- Move your cursor over part of the window edge.
- Click and drag, then drop the border in the required position.
General Results Display Procedures
- Display Test Results
- Zoom In and Out of a Graph
- Customize Graph Display
- Export Test Results
- Close Test Results
- Delete Test Results
Display Test Results
- In the Repository Window, double-click
Tests to expand the directory structure.
- Double-click the Test
, whose results you want to display.
- In the Test Pane click the
Results tab.
- In the Results Window, click
next to a Test-run folder or double-click on it to open the folder and view a list of results display options and Task Group results folders.
- Click
- A ticked check box to the left of a display option indicates that it is open in the Test Pane.
- Note: Click
, in the Title Bar of a graph or table to close it or deselect the display option in the Results Window.
- Tip: All available results have display and output options associated with them. These options may include filtering, customizing and exporting. Right-click within a graph or table to display and select from the choices available.
- Use the Windows option in the Menu Bar to control the display of graphs and tables. Or, right-click within the empty workspace of the Test Pane to access these functions.
See also:
Customize Graph Display
- Open a Test and click the
- In the Results Window, double-click on a Test-run folder or click
- Click on a graph display results option to open your selection in the Test Pane.
- Right-click inside the graph and select Customize.
- Select the Graph Type you want:
- Line plot: A single line connecting values.
- Vertical bars: A single, solid vertical bar per value.
- Area under points: The area beneath the line plot is filled.
See also:
Display Custom Collector Graphs
Zoom In and Out of a Graph
- Open a Test and click the
- In the Results Window, click
- Click
- Click and drag over the area of the graph you want to zoom in on and release your mouse button.
- Double-click anywhere in the graph to zoom out and return to the full graph display.
Export Test Results
- Open a Test and click the
- In the Results Window, click
- Click
- Right-click inside the graph or table and select either Export to Excel (graphs), or Export (tables and lists).
- Note: The Export to Excel option automatically launches Excel and converts the data into Microsoft Excel Workbook format. Save and edit your results as required.
- The Export option enables you to export results as a .CSV file. The Test Configuration results option only supports text file format for exporting data.
Close Test Results
- Click
- Use the Results Window to close a graph or table by clicking on the results option and unchecking the check box to the left of the option.
- Open a different Test or a Collector from the Repository Window.
Delete Test Results
- Open a Test and click the
- Click
, in the toolbar.
- In the Delete Test-runs dialog box, select the Test-runs you want to delete.
- Click Delete to remove the results from the Repository.
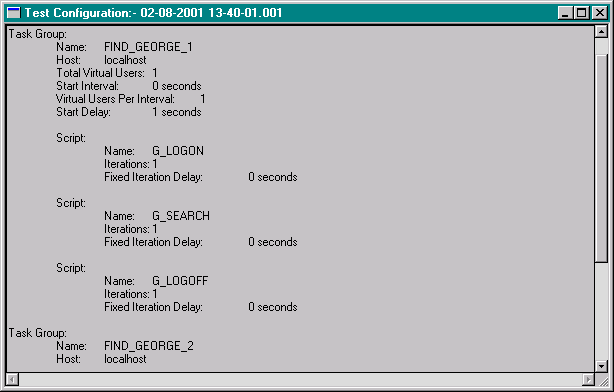
Test Configuration
The Test Configuration display option consists of a summary of data collected during a Test-run. It provides data relating to the Task Groups, Scripts, Hosts and Virtual Users that comprised the Test-run.
See also:
Display Test Configuration
- Open a Test and click the
- In the Results Window, double-click on a Test-run folder or click
- Click the Test Configuration results option in the list.
Test configuration information is displayed in the Results tab in the following format:See also:
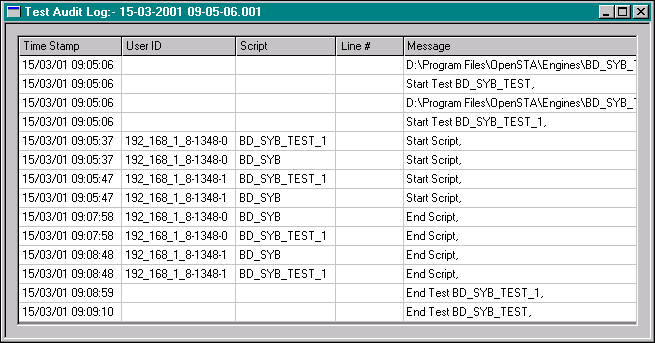
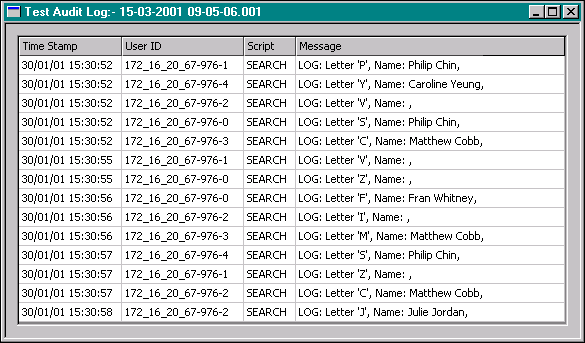
Test Audit Log
The Test Audit log contains a list of significant events that have occurred during a Test-run. These include the times and details of Test initiation and completion, errors that may have occurred and Virtual User details.
Additional Audit log entries may be written to the log if the Scripts included in the Test have been modeled to incorporate the appropriate SCL code. Use the LOG SCL command in a Script, to generate the data content for the Test Audit log. For more information on SCL refer to the SCL Reference Guide; an on-line copy is available within the Script Modeler, Help menu.
See also:
Display Test Audit Log Data
- Open a Test and click the
- In the Results Window, click
- Click the Test Audit Log results option in the list.
- Audit information is displayed in the Results tab in table format:
- Tip: Display multiple graphs and tables concurrently to compare results using the Results Window.
- Note: Click
- Tip: You can export the data displayed in the Test Audit Log by right-clicking within the table and selecting Export. The data is exported in CSV format.
See also:
Test Report Log
The Test Report log is a sequential text file that is used to record information about a single Test-run. Usually, a single record is written to the Report log whenever a Test case passes or fails.
Additional Report log entries may be written to the log if the Scripts included in the Test have been modeled to incorporate the appropriate SCL code. Use the REPORT SCL command in a Script, to generate the data content for the Test Report log. For more information on SCL refer to the SCL Reference Guide; an on-line copy is available within the Script Modeler, Help menu.
See also:
Display Test Report Log Data
- Open a Test and click the
- In the Results Window, click
- Click the Test Report Log results option in the list.
- Report information is displayed in the Results tab in table format:
- Tip: Display multiple graphs and tables concurrently to compare results using the Results Window.
- Note: Click
- Tip: You can export the data displayed in the Test Report Log by right-clicking within the table and selecting Export. The data is exported in CSV format.
See also:
Test History Log
The Test History log is a sequential text file that is used to maintain a chronological history of each occasion on which the Test was run, together with the results of that Test. Usually, a single record is written to the History log when the Test-run is complete.
In addition, further Test History log entries may be written to the log if the Scripts included in the Test have been modeled to incorporate the appropriate SCL code. Use the HISTORY SCL command in a Script, to generate the data content for the Test History log. For more information on SCL refer to the SCL Reference Guide; an on-line copy is available within the Script Modeler, Help menu.
See also:
Display Test History Log Data
- Open a Test and click the
- In the Results Window, click
- Click the Test History Log results option in the list.
- History information is displayed in the Results tab in table format.
- Tip: Display multiple graphs and tables concurrently to compare results using the Results Window.
- Note: Click
- Tip: You can export the data displayed in the Test History Log by right-clicking within the table and selecting Export. The data is exported in CSV format.
See also:
Test Error Log
The Test Error Log records all significant error messages from the Test Manager, Task Group Executers and OpenSTA Daemon.
Data included in the log are: Time Stamp, Test Name, Location and Message.
See also:
Display the Test Error Log
- Open a Test and click the
- In the Results Window, click
- Click the Test Error Log display option in the list to open it in the Test Pane.
- Test Error Log data is displayed in table format.
- Tip: Display multiple graphs and tables concurrently to compare results using the Results Window.
- Note: Click
- Tip: You can export the data displayed in the Test Error Log by right-clicking within the table and selecting Export. The data is exported in CSV format.
See also:
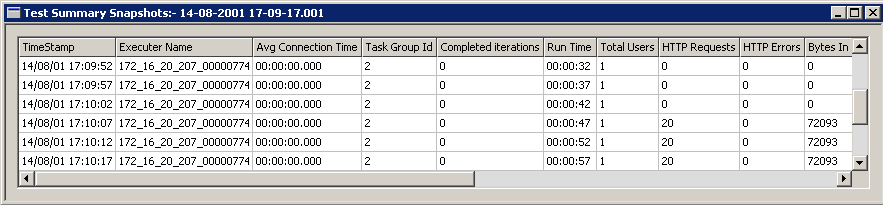
Test Summary Snapshots
The Test Summary Snapshots option displays a variety of Test summary data captured during a Test-run. Snapshots of Test activity are recorded at defined intervals and summarized in table format. You can set this interval in seconds using the Task Monitor Interval button.
The test statistics provided relate mainly to Task and HTTP request behavior. They are particularly useful in determining the number of HTTP requests issued, request duration and the time elapsed between request issue and results receipt during Tests-runs.See also:
Display Test Summary Snapshots
Display Test Summary Snapshots
- Open a Test and click the
- In the Results Window, click
- Click the Test Summary Snapshots display option in the list to open it in the Test Pane.
Test Summary Snapshots data is displayed in table format:
- TimeStamp: Gives the time of the Task execution.
- Executer Name: Provides the IP address of the machine on which the test executes.
- Avg Connection Time: Shows the average length of time for a TCP connection.
- Task Group ID: Shows the ID corresponding to the Task Group.
- Completed Iterations: Shows the number of times a task has been executed.
- Run Time: Indicates the total execution time of the Task.
- Total Users: Gives the total number of users.
- HTTP Requests: Shows the total number of HTTP requests within the Task.
- HTTP Errors: Indicates the number of 4XX and 5XX error codes returned from the Web browser after the HTTP request has been sent. These error codes adhere to the World Wide Web Consortium (W3C) standards. For more information visit: http://w3.org/Protocols/HTTP/HTRESP.
- Bytes In: Gives the number of bytes received for the HTTP request results.
- Bytes Out: Shows the number of bytes sent for the HTTP request.
- Min Request Latency: Indicates the minimum length of time elapsed in milliseconds between sending an HTTP request and receiving the results.
- Max Request Latency: Shows the maximum length of time elapsed in milliseconds between sending an HTTP request and receiving the results.
- Average Request Latency: Gives the average length of time elapsed in milliseconds between sending an HTTP request and receiving the results.
- Task 1(VUs): Shows the number of virtual users for a Task.
- Task 1(Iterations): Gives the number of iterations for a Task.
- Task 1(Period): Shows the duration of a Task.
Note: If your Task Group consists of multiple Tasks, extra columns corresponding to the respective Task numbers are included in the Test Summary Snapshots table.
Note: ClickSee also:
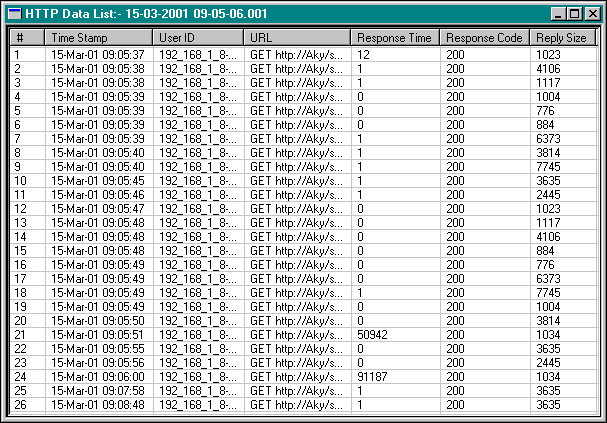
HTTP Data List
The HTTP Data List stores details of the HTTP requests issued by the Scripts included in a Test when it is run. This data includes the response times and codes for all the HTTP requests issued. The amount of HTTP data recorded depends on the Logging level specified for a Script-based Task Group when you created the Test and defined the Virtual User settings to be applied. The Logging level setting controls the number of Virtual Users that statistics are gathered for and can be edited from the Configuration tab of the Test Pane.
The data is presented in a table and can be sorted by clicking on the column headings to reverse the display order of the data entries. These results can also be filtered by right-clicking inside the table and selecting the Filter option. Use the Export right-click menu option to export data in .CSV text file format which allows them to be imported into other data analysis and report generating tools.
See also:
Display the HTTP Data List
- Open a Test and click the
- In the Results Window, click
- Click the HTTP Data List display option in the list to open it in the Test Pane.
See also:
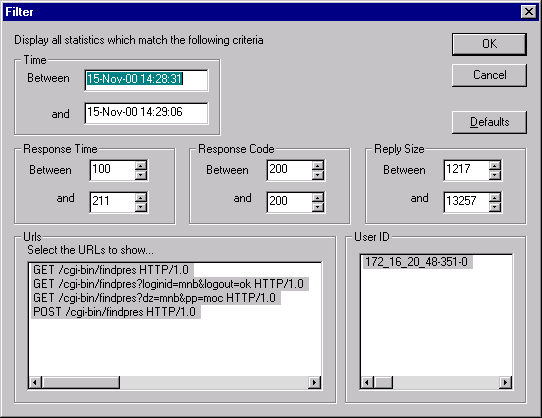
Filter HTTP Data List
- Open a Test and click the
- In the Results Window, click
- Click on a graph display, results option to open your selection in the Test Pane.
- Click
- The filter criteria available correspond to the column categories in the HTTP Data List table. Select your settings from the filter options:
- Time: Date and time HTTP GETs and POSTs were issued.
- Response Time: Web site response time to GETs in milliseconds.
- Response Code: Code issued by Web site in response to GETs.
- Reply Size: Size of data response to GETs issued by Web site in bytes.
- URLs: Filter by URL.
- User ID: Filter by Virtual User(s) identity (IP address).
See also:
HTTP Data Graphs
The volume of HTTP data recorded is controlled by the Logging level you set for a Task Group's Virtual Users. The Logging level determines the number of Virtual Users that data is collected for and controls the quality of the data displayed in the graphs. The HTTP data collected relates only to responses to HTTP requests issued as part of Test.
The HTTP data collected during a Test-run can be displayed in a number of different graphs where you can scrutinize your Test results. There are seven graphs in total which you can display using the Results Window.
Right-click within a graph and select to Customize, Export to Excel Filter URLs.
See also:
Filter URLs in HTTP Data Graphs
HTTP Response Time (Average per Second) v Number of Responses Graph
HTTP Errors v Active Users Graph
HTTP Errors v Elapsed Time Graph
HTTP Responses v Elapsed Time Graph
HTTP Response Time v Elapsed Time Graph
HTTP Active Users v Elapsed Time Graph
Display HTTP Data Graphs
- Open a Test and click the
- In the Results Window, click
- Click on an HTTP data list option such as HTTP Monitored Bytes / Second v Elapsed Time to open your selection in the Test Pane.
- This graph shows the total number of bytes per second returned during the Test-run.
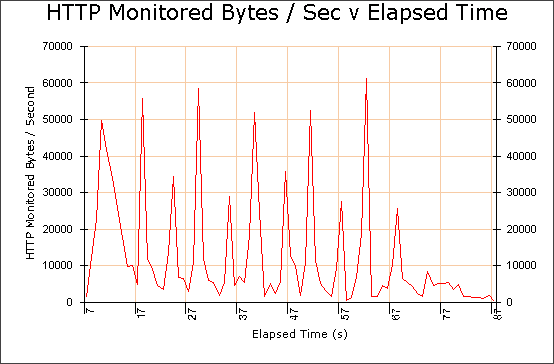
- Note: Graphs are displayed in the default line plot style.
- Tip: Right-click within the graph and use the menu options to Customize, Filter URLs and Export to Excel.
- Note: Click
See also:
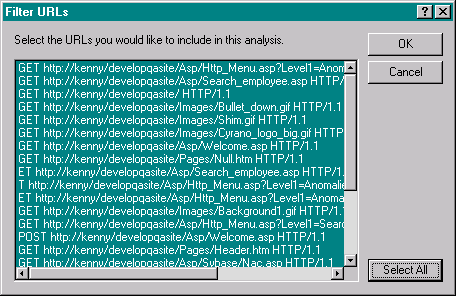
Filter URLs in HTTP Data Graphs
- Open a Test and display an HTTP data graph in the Test Pane.
- Click
, in the toolbar or right-click inside a graph then select Filter URLs.
- In the Filter URLs dialog box select the URLs you want to view.
- Click OK to display the selected URLs.
See also:
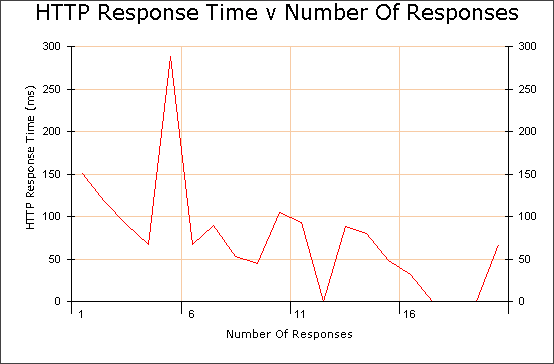
HTTP Response Time (Average per Second) v Number of Responses Graph
This graph displays the average response time for requests grouped by the number of requests per second during a Test-run.
Tip: Right-click within the graph and use the menu options to Customize, Filter URLs and Export to Excel.
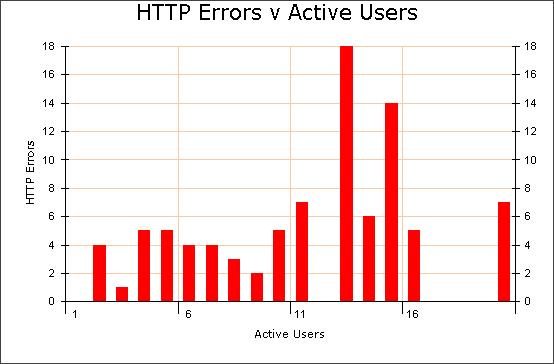
HTTP Errors v Active Users Graph
This graph is used to display the effect on performance measured by the number of HTTP server errors returned as the number of active Virtual Users varies during a Test-run.
Note: This graph has been customized to display data points as vertical bars. Right-click within a graph and select Customize, then select Graph Type, Vertical bars.
Make use of the Filter URLs and Export to Excel options associated with this graph by right-clicking within it.
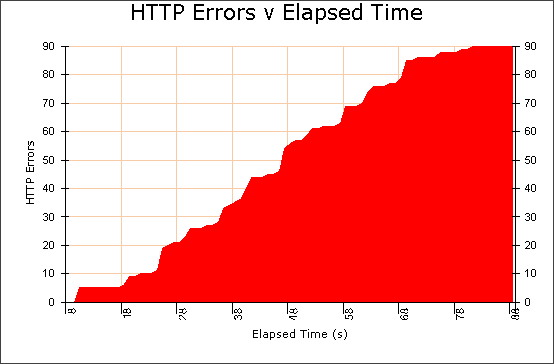
HTTP Errors v Elapsed Time Graph
This graph displays a cumulative count of the number of HTTP server errors returned during the Test-run.
Note: This graph has been customized to display the area under the data points as a solid. Right-click within a graph and select Customize > Area under points from the menu to change the appearance of your graphs.
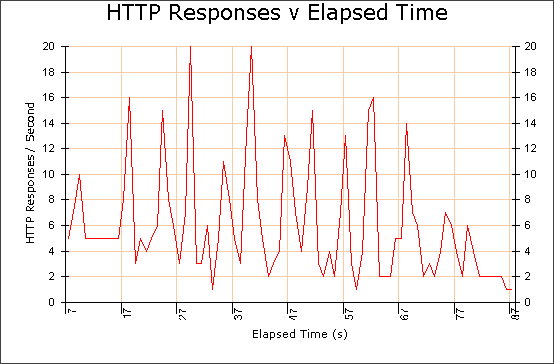
HTTP Responses v Elapsed Time Graph
This graph displays the total number of HTTP responses per second during the Test-run.
Right-click within a graph and select to Customize or Export to Excel.
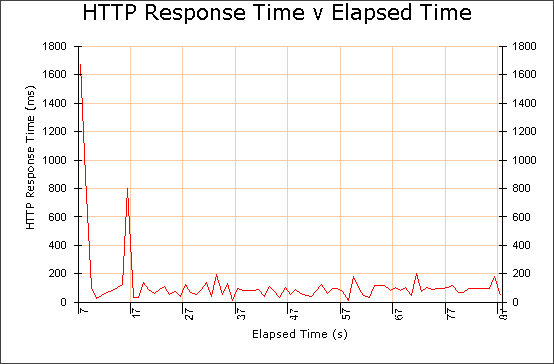
HTTP Response Time v Elapsed Time Graph
This graph displays the average response time per second of all the requests issued during the Test-run.
Use the right-click menu options to Customize, Export to Excel Filter URLs.
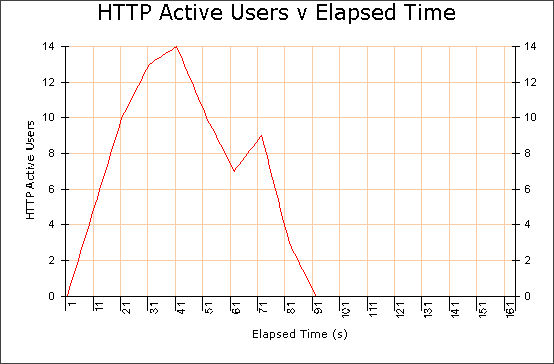
HTTP Active Users v Elapsed Time Graph
This graph displays the total number of active Virtual Users sampled at fixed intervals during a Test-run.
Right-click within the graph and use the menu options to Customize or Export to Excel.
Single Step Results
During Test development it is important to check that a Test runs correctly. You can run a single stepping session to help verify a Test by monitoring Task Group replay to check that the WAE responses are appropriate. Then use the Single Step Results option to analyze the results data obtained. The data includes the HTTP requests issued to a target WAE and the HTTP returned in response during a single stepping session.
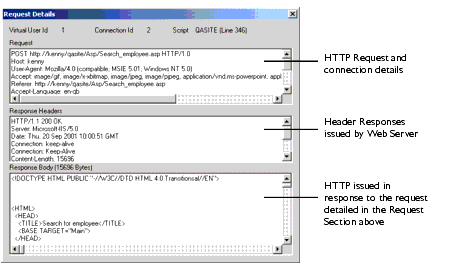
Single stepping a Test is a useful method to help you verify that a Test with a modular structure runs as you expect. A modular Test incorporates two or more Scripts in one Task Group to simulate a continuous Web browser session when the Test is run and requires some modeling of the Scripts included. After single stepping the Task Group that contains the Script sequence, open up the Single Step Results option and double-click on an HTTP request to display the request details.
View the details of the HTTP request in response to which the first cookie was issued during a Test-run. In the Response Header section of the Request Details window look for the Set-Cookie entry and make a note of the cookie ID including its name and value. Then view first request included in the next Script in the sequence and look in the Request section of the Request Details window for the Cookie entry. The cookie ID recorded here should be the same as the first cookie value issued at the end of the previous Script. Ensure that the value of the last cookie issued in each Script is handed onto the next Script in the sequence, for all the Scripts in the Task Group.
See also:
Developing a Modular Test Structure
Display Single Step Results
- Open a Test and click the
- In the Results Window, double-click on a single stepping Test-run folder
or click
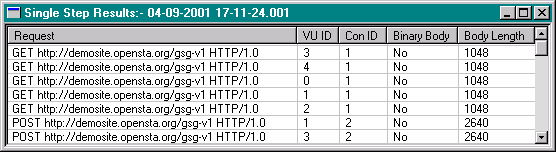
- Click the Single Step Results display option to open your selection in the Test Pane.
- Request: Displays the HTTP request details.
- VU ID: Gives the ID of the Virtual User associated with the HTTP request.
- Con ID: Shows the Connection ID corresponding to the number of connections to the Web Server.
- Binary Body: Indicates whether the file loaded in response to the HTTP request is binary or non-binary.
- Body Length: Gives the size in bytes of the file loaded in response to the HTTP request.
See also:
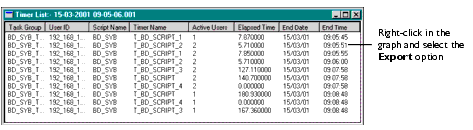
Timer List
The Timer List file gives details of the Timers recorded during a Test-run. Timer results data records the time taken to load each Web page specified by a Script for every Virtual User running the Script during a Test-run. The level of Timer information recorded is controlled by adjusting the Virtual User settings in the Test's Script-based Task Groups. Open the Test with the Configuration tab of the Test Pane displayed, then click on a VUs table cell in a Task Group and check the activate the Generate Timers for each page option in the Properties Window. The Logging level you select here controls the volume of HTTP data and the number of timers recorded.
The information collected is presented in a table and can be sorted by clicking on the column headings to reverse the display order of the data entries.
Timer List can be exported to a .CSV text file which allows results to be imported into many other data analysis and report generating tools.
See also:
Timer Values v Active Users Graph
Timer Values v Elapsed Time Graph
Display the Timer List
- Open a Test and click the
- In the Results Window, double-click on a Test-run folder or click
- Click the Timer List display option to open your selection in the Test Pane.
- Timer List information is displayed in table format:
- Note: Right-click within the graph and select Export to save the data to a .CSV text file, which allows results to be imported into other data analysis and report generating tools.
- Tip: Display multiple graphs and tables concurrently to compare results using the Results Window.
- Note: Click
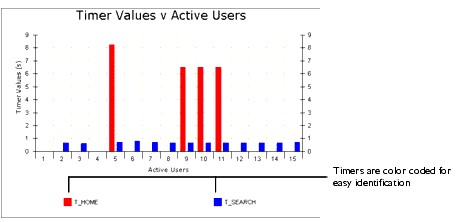
- Tip: To improve the display of your results use the Customize, option to display your data in vertical bars style. If your timer names and color coding key is not displayed, you can maximize the display area by double-clicking in the title bar of the graph.
Timer Values v Active Users Graph
This graph is used to display the effect on performance as measured by timers, as the number of Virtual Users varies.
You can control the information displayed by filtering the timers. The Select Timers to display dialog box appears when you choose this option from the Results Window. Use it to select the timers you want to view, then click OK to proceed.
Right-click within a graph and select to Customize, Export to Excel Filter URLs.
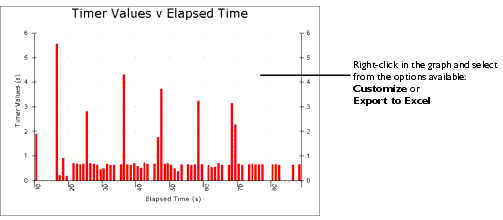
Timer Values v Elapsed Time Graph
This graph is used to display the average timer values per second.
You can control the information displayed by filtering the timers. The Select Timers to display dialog box appears when you choose this option from the Results Window. Use it to select the timers you want to view, then click OK to proceed.
Right-click within a graph and select to Customize, Export to Excel Filter URLs.
SNMP and NT Performance Collector Graphs
The data collection queries defined in a Collector generate results data that can be displayed in custom graphs. A maximum of two custom graphs are produced per Test-run. All NT Performance Collector data is displayed in the Custom NT Performance graph. All SNMP Collector data is displayed in the Custom SNMP graph.
If your Test includes more than one NT Performance or SNMP Collector, the appropriate custom results graph combines the data collection queries from all Collectors of the same type and displays them in one graph which you can then filter to display the data you require.
Use the Filter option to select and display specific data collection queries defined in the Collectors. The unique names you assigned to each query are displayed below the graph in a color coded key. The IP address of the Host used to run the Collector Task during a Test-run is automatically listed alongside the query name.
Right-click within a graph and select to Customize, Export to Excel Filter.
See Also:
Display Custom Collector Graphs
Filter Custom Collector Graphs
Display Custom Collector Graphs
- Open a Test and click the
- In the Results Window, double-click on a Test-run folder or click
- Click the Custom NT or Custom SNMP from the list results option to open your selection in the Test Pane.
- The Custom NT Performance Graph is displayed below:
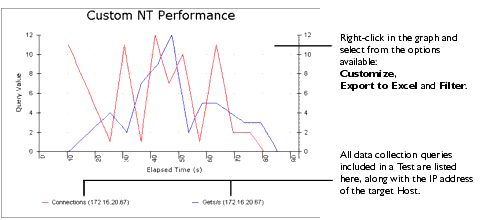
- Note: Graphs are displayed in the default line plot style. Right-click within a graph and select Customize from the menu to change their appearance.
- Tip: Right-click within the graph and use the menu options to Customize, Export to Excel and Filter the data.
- Tip: Display multiple graphs and tables concurrently to compare results using the Results Window.
- Note: Click
See Also:
Filter Custom Collector Graphs
Filter Custom Collector Graphs
- Open a Test and display a Custom Collector graph in the Test Pane.
- Click
- Use the Filter dialog box to select the data collection queries you want to display.
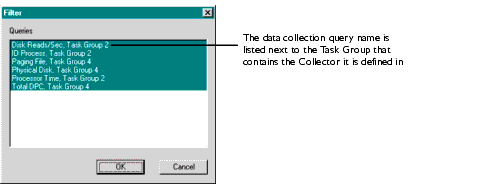
- Note: If you have more than one Collector of the same type referenced in a Test, all the results collected are merged and displayed in one custom graph.
- The Filter dialog box displays the data collection queries alongside the Task Group name indicating which Collector a data collection query belongs to.
- In the Filter dialog box select the data collection queries you want to view.
- Click OK to display the selected queries.
See Also:
Display Custom Collector Graphs
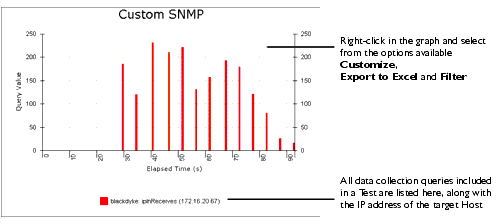
Custom SNMP Graph
The Custom SNMP graph displays results returned by all the SNMP Collectors executed during a Test-run. You can filter the data collection queries displayed to control the amount of data displayed.
The data collection queries as defined in the Collectors referenced by a Test are color coded for easy identification. Each query displays the IP address of the Host targeted during a Test- run.
There is a right-click menu associated with the custom graph. Use the Customize option to change the appearance of the graph. Other options include the Export to Excel option which enables you to convert data for further analysis and output, and the Filter option which is used to display specific data collection queries.
See Also:
Display Custom Collector Graphs
|
OpenSTA.org Mailing Lists Further enquiries Documentation feedback CYRANO.com |